It's always DNS: Episode #3416
As part of my work at Hasgeek, I also work on and maintain Hasjob, a job board for startups. To monitor any downtime, we use Uptime Robot. For last few days, uptime robot has been sending out alerts now and then that Hasjob was going down 10-15 minutes as a time. But when I visited the home page, it was working, even when uptime robot was reporting it to be down. So I thought it might be some issue that’s affecting some requests and not the others. I looked into the logs but couldn’t find anything meaningful. Except one expensive query that we run, which is supposed to be async. We pushed a fix for it yesterday morning, which was supposed to make things better. But suddenly we started getting complaints that the job posts were not loading at all. I go and check. The home page was loading but none of the job posts were. It was 9:43PM on a Friday night, but we had to fix it. So I started digging in.
First observation from uwsgi log was that every request to a jobpost page was taking 30+ seconds to load. Every single one of them. Some were taking 60-90 seconds. So we now know that Nginx is giving up on waiting for uwsgi requests because uwsgi is taking too much time to respond.
My first hunch was the expensive query. We recently upgrade to Postgres 12. I saw that logging wasn’t turned on, so I turned it on for expensive queries. It was logging the expensive queries, but after some observation, found no correlation between them and the HTTP requests. There were more requests that were timing out, than expensive queries. So that’s out the window.
So it’s most likely the application taking time to respond. But we didn’t make any changes to the application recently that could affect application response time this much. Something else must suddenly be taking too much time. That’s where I decided to profile the requests. We don’t use Newrelic or any other service that runs a profiler on each request. That’s something we are going to do after last night I think.
Anyway, Hasjob is a flask application that runs on uwsgi. So I look into how to put a profiler in between. Went through a bunch of Python profiler packages and none of them seem to fit in my use case. I needed something simple and plug-and-play to run the profiler on a production application. After some scrambling I stumbled upon werkzeug’s ProfilerMiddleware. We already use werkzeug because of Flask, so this seemed perfect.
Our wsgi file looked like this -
# -*- coding: utf-8 -*-
import os.path
import sys

from hasjob import app as application

__all__ = ['application']

sys.path.insert(0, os.path.dirname(__file__))
Now I updated to this -
# -*- coding: utf-8 -*-
import os.path
import sys
from werkzeug.middleware.profiler import ProfilerMiddleware

from hasjob import app as application

application.config['PROFILE'] = True
application.wsgi_app = ProfilerMiddleware(
    application.wsgi_app,
    restrictions=[5],
    profile_dir='/path/to/profiler/directory'
)

__all__ = ['application']

sys.path.insert(0, os.path.dirname(__file__))
restrictions says that show only top 5 issues, and profile_dir says to log all the profiles in the provided directory. I didn’t turn off stream output so at the same time the profiler was spitting out the outputs in uwsgi log.
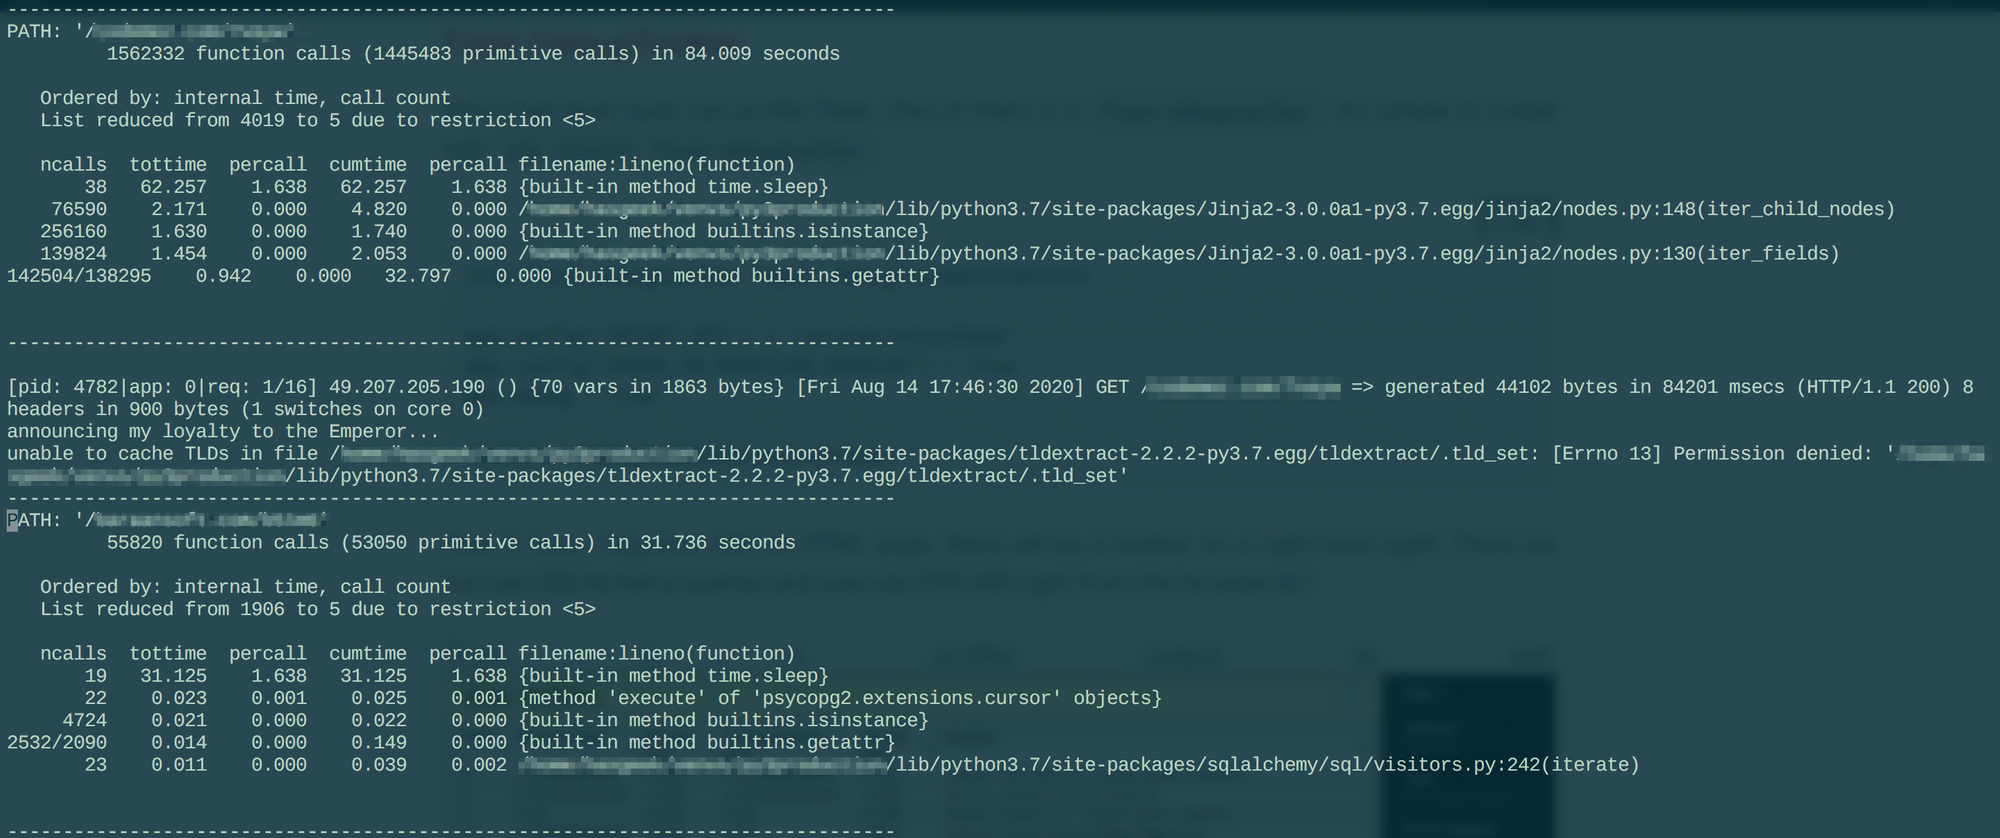
And with much amaze I see that all the requests were going through 19-38 time.sleep calls that were delaying them. Which was confusing as hell. So something was definitely blocking the application. My guess once again was an expensive query. Now to look into what exactly was blocking the application.
The most popular solution to analyse the profile files I came across was to use gprof2dot to turn the profile files into dot files. And then use graphviz to turn that dot file into a graphical representation of all the method calls. They look something like this.
So I install gprof2dot convert one profile file and transfer it to my laptop. I didn’t know how much time or processing power it’ll require. I install graphviz on my laptop and start processing the dot file at around 12AM. By the time you reach the end of the blog post, it was 1:30AM and that file was still processing. I gave up around 12:20 AM. It was Friday night and every minute some user was getting timed out.
I started looking into how else to analyse it. And came across pstats. Let’s give this a try.
import pstats
stats = pstats.Stats('directory/GET.foobar.000255ms.1392663371.prof')
stats.sort_stats('time', 'calls')
stats.print_callers('time.sleep')
Just to find that the caller of time.sleep is -
<path_to_venv>/lib/python3.7/site-packages/eventlet/hubs/poll.py:71(wait)
I’m like, “Ok..”, but why? So I check the caller of above, just to find this -
<path_to_venv>/lib/python3.7/site-packages/dns/resolver.py:972(resolve)
And I’m like, “Ehhh….!!” This is what was left?
I boot up a Python shell and try this -
>>> import dns.resolver
>>> resolver = dns.resolver.Resolver()
>>> resolver.timeout = 30
>>> resolver.lifetime = 30
>>> resolver.query('bibhasdn.com', 'MX')
Traceback (most recent call last):
  File "<input>", line 1, in <module>
    resolver.query('bibhasdn.com', 'MX')
  File "/<path_to_venv>/lib/python3.7/site-packages/dns/resolver.py", l
ine 1091, in query
    True)
  File "/<path_to_venv>/lib/python3.7/site-packages/dns/resolver.py", l
ine 1043, in resolve
    timeout = self._compute_timeout(start, lifetime)
  File "/<path_to_venv>/lib/python3.7/site-packages/dns/resolver.py", l
ine 950, in _compute_timeout
    raise Timeout(timeout=duration)
dns.exception.Timeout: The DNS operation timed out after 31.13741111755371 seconds
I’m like, “Really?”
After a few more print_callers() calls I find out the root of the issue. We use this library called [mxsniff](https://github.com/jace/mxsniff) that checks if an email address is from a public email domain. We forgot to add a cache for each domain checks, so it was making DNS queries on every request. DNS queries were timing out and so were the requests.
Now to look into why the DNS queries were timing out. I go look into the github repository dnspython that provides dns.resolver. Just to find this -
 GitHub
:|
I downgrade dnspython to previous available version and the site is back up. All within about 30 seconds.
The graphviz command was still running. I hit Ctrl+C. I won’t recommend doing it unless you have a supercomputer I guess.
Overall it was actually a fun Friday night. I never had to profile a production server by hand. We use flask-debugtoolbar locally, so that usually takes care of everything when developing.
Hope this experience helps someone someday.
Update: I wrote a small rough script that takes in a profile file, a method name and depth level and returns the chain of callers leading upto the method. Gonna use it next time.
Gist